Three command-line tools that each do one job well. rgen makes realistic test data, qdata runs your SQL as a pipeline, and asql turns a query into a dashboard. Each one is a single binary on an embedded DuckDB engine: no server, no account, no telemetry.
Use one, or chain all three. Each is free, with no row or pipeline limits.
rgen
Realistic test data from one command.
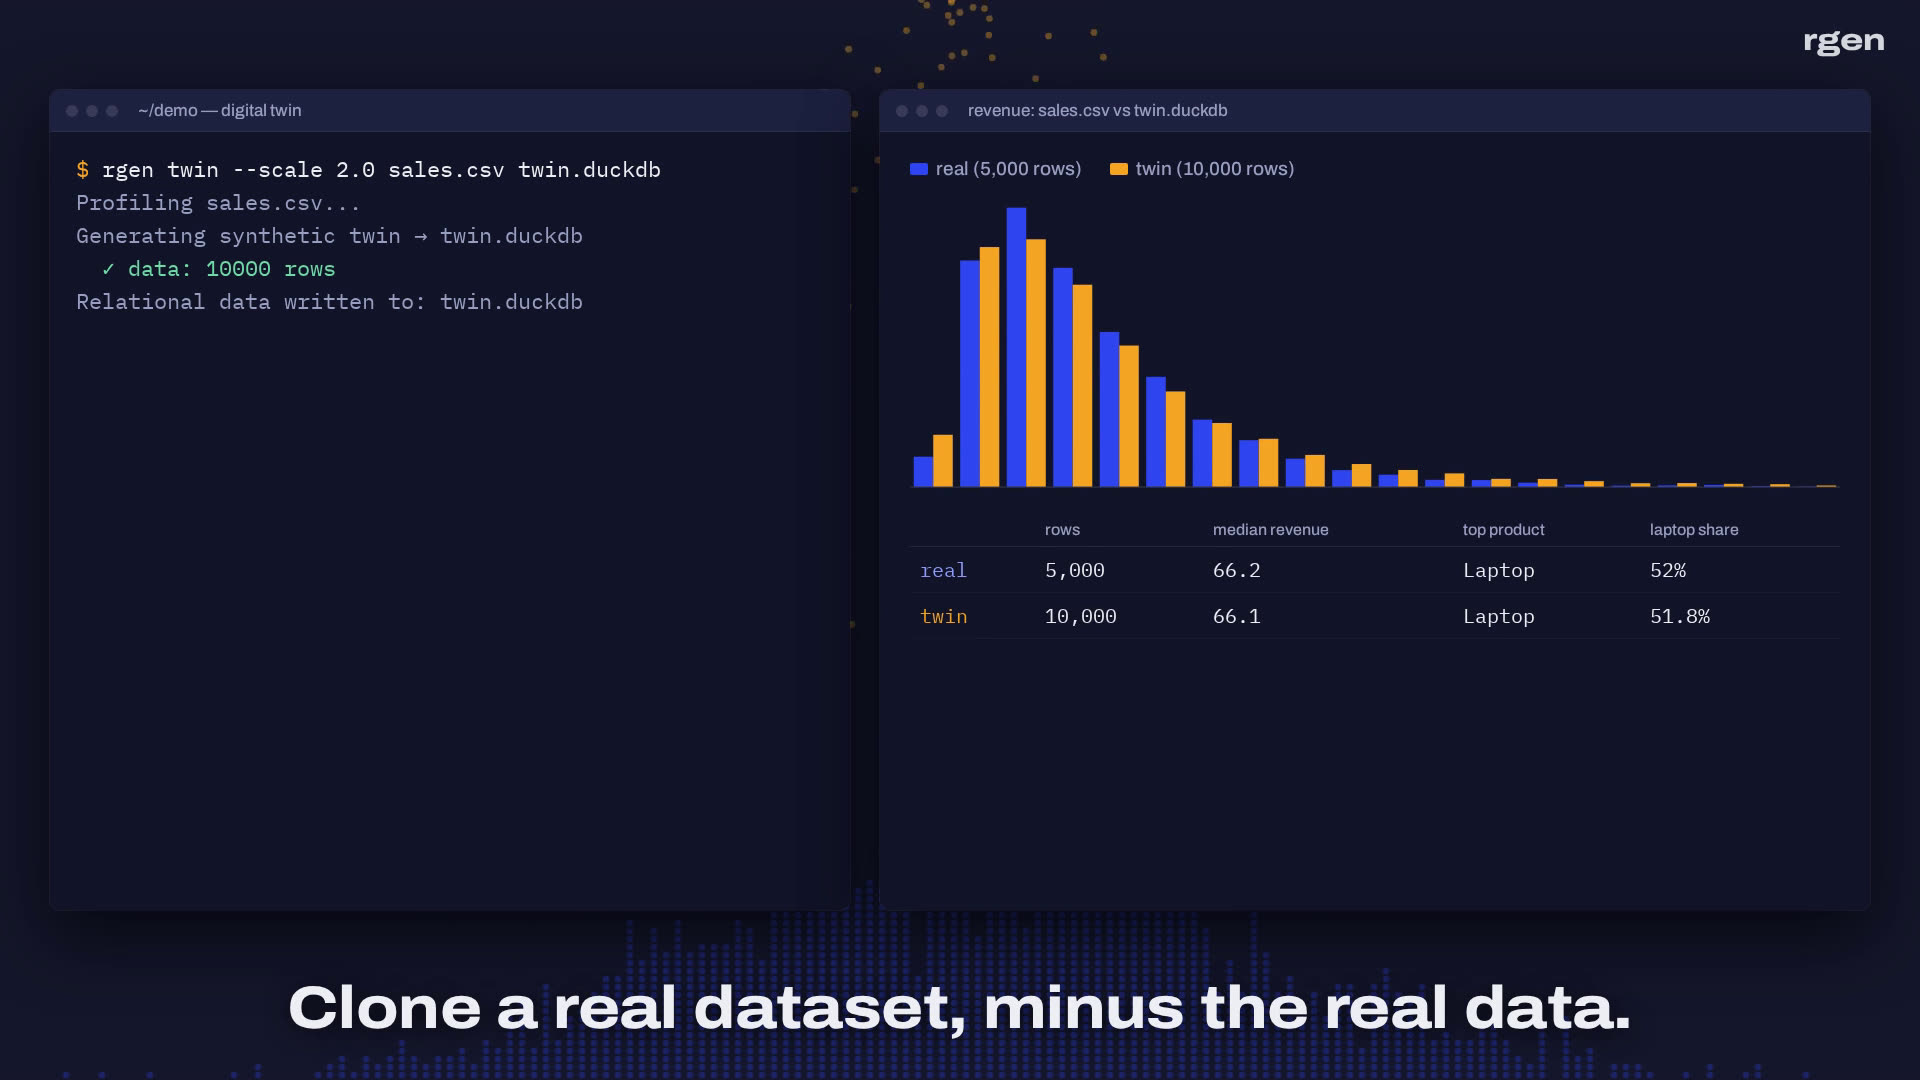
Names that match their emails, cities that exist, amounts with a real long tail and foreign keys that join. Time series, lifecycles and digital twins of real datasets, written to CSV, JSON, Parquet, Excel, DuckDB or SQLite.
$curl -fsSL https://cuiqanalytics.github.io/rgen/install.sh | sh
Number your SQL files and run one command. Every step is logged and cached, so after a fix you replay from that step. It fetches and crawls websites too, and you parse the pages with XPath in plain SQL. No Airflow, no Python environment.
$curl -fsSL https://cuiqanalytics.github.io/qdata/install.sh | sh
Write the query you already know, add a few -- @ comments, and asql renders it into a polished, self-contained HTML report. No BI tool, no notebook, no JavaScript. The SQL stays a file you can read, diff and own.
Linux binaries, plus Docker images for macOS and Windows: ghcr.io/cuiqanalytics/rgen, qdata and asql.
How they fit together
The tools share an engine and a language, so the output of one is the input of the next. No glue code, no conversion step.
1
Make the data
rgen builds tables that join and look like production: customers, orders, events, readings. Test the pipeline before the real data arrives, or share data you can't hand out.
2
Shape it with SQL
qdata runs a folder of numbered SQL files: ingest, validate, transform, export. Bring in files, databases or web pages and keep a log of every run.
3
Show the result
asql turns the final queries into one HTML file: a dashboard for the team or a narrative report for the board. Email it, commit it or put it on any static host.
# make data that looks real$rgen run -n 50000 --config shop.toml shop.duckdb
✓ customers, orders, order_items written
# clean and model it in numbered SQL files$qdata run my_pipeline
✓ 4 steps, each logged and cached
# ship the result as one HTML dashboard$asql build report.sql
✓ report.html
The same flow in a terminal: three tools, plain SQL in between, everything on your machine.
What they share
Plain SQL
Your logic lives in SQL files you can read, review and diff. Nothing you write is locked into a proprietary format.
Local-first
Everything runs on your laptop or your own server. Your data never leaves your machine, and the tools work offline.
One binary, DuckDB inside
A single download with an embedded DuckDB engine. No Python environment, no database server, no scheduler to stand up.
Ready for AI agents
Each tool ships a Claude Code skill, so an agent writes correct configs, pipelines and reports, and you keep the readable files.
No account, no telemetry
Install and run. Nothing phones home, and nothing needs a sign-up.
Free to use
The tools are free with no row or pipeline limits. Optional paid add-ons fund the work.
Pricing
The tools are free. Two of them have optional extras.
cuiqanalytics builds tools for people who work with data and want fewer moving parts. We think most analytics work fits on one machine, that SQL is the right language for it, and that a tool should be a download, not a platform.
Questions, ideas or a bug to report? Write to us, or open an issue on GitHub.

 rgen
 qdata
 asql